Starting with R 3.6.0 a new hcl.colors() function is available in grDevices,
providing a wide range of HCL-based color palettes with much better perceptual
properties than existing RGB/HSV-based palettes like rainbow(). An
accompanying new hcl.pals() function lists available palette names for
hcl.colors(). It is a basic and lean implementation of the pre-specified
palettes in the colorspace
package, closely approximating palettes from many other packages like
ColorBrewer, CARTO, viridis, scico, etc.
The default colors for image() and filled.contour() are now based on
hcl.colors(). Palette-generating functions rainbow(), gray.colors(), etc.
get a new rev argument to facilitate reversing the order of colors.
HCL vs. RGB/HSV palettes
HSV (hue-saturation-value)
is a simple transformation of the
RGB (red-green-blue) space
which was therefore a convenient choice for color palettes in many software
systems (see also ?hsv). However, HSV colors capture the perceptual
properties hue, colorfulness/saturation/chroma, and
lightness/brightness/luminance/value only poorly and consequently
the corresponding palettes are typically not a good choice for statistical
graphics and data visualization, see
http://colorspace.R-Forge.R-project.org/articles/endrainbow.html.
In contrast,
HCL (hue-chroma-luminance) colors
are much more suitable for capturing human color perception (see also ?hcl).
As discussed in our recent arXiv:1903.06490
paper, better color palettes can be derived based on HCL coordinates.
Conceptually, three types of palettes are often distinguished:
- Qualitative: For coding categorical information, i.e., where no particular ordering of categories is available and every color should receive the same perceptual weight.
- Sequential: For coding ordered/numeric information, i.e., where colors go from high to low (or vice versa).
- Diverging: Designed for coding numeric information around a central neutral value, i.e., where colors diverge from neutral to two extremes.
The hcl.colors() function provides a basic and lean implementation of
the pre-specified palettes in the colorspace package, see
http://colorspace.R-Forge.R-project.org/articles/hcl_palettes.html.
In addition to the types above, the functions distinguish “diverging” palettes
where the two arms are restricted to be rather balanced as opposed to flexible
“divergingx” palettes that combine two sequential palettes without any
restrictions. The latter group also includes the cividis palette as it is based
on two different hues (blue and yellow) but it is actually a sequential palette
(going from dark to light).
Available HCL palettes
The names of all available HCL palettes can be queried with the hcl.pals()
function and they are also visualized by color swatches when running
example("hcl.colors"). Many of the palettes closely approximate palettes of
the same name from various other packages (including RColorBrewer,
rcartocolor, viridis, scico, among others, see
http://colorspace.R-Forge.R-project.org/articles/approximations.html).

The default HCL palette is the widely used viridis palette which is a sequential
palette with relatively high chroma throughout so that it also works reasonably
well as a qualitative palette. However, while viridis is a rather robust default
palette, more suitable HCL palettes are available for most visualizations. For
example, "Dark 3" works well for shading points or lines in up to five groups,
"YlGnBu" is a sequential palette similar to "viridis" but aligned
chroma/luminance, and "Green-Brown" or "Blue-Red 3" are colorblind-safe
diverging palettes.
Default palettes for heat maps in graphics
The only functions in the graphics package that used the RGB/HSV-based palettes
for their default colors were the heat maps with image() using heat.colors()
and filled.contour() using cm.colors(). Their defaults have been changed
now to the "YlOrRd" palette that closely approximates the ColorBrewer palette
of the same name. This has been adopted because it is a sequential rather than
diverging palette and uses similar hues as heat.colors() previously.
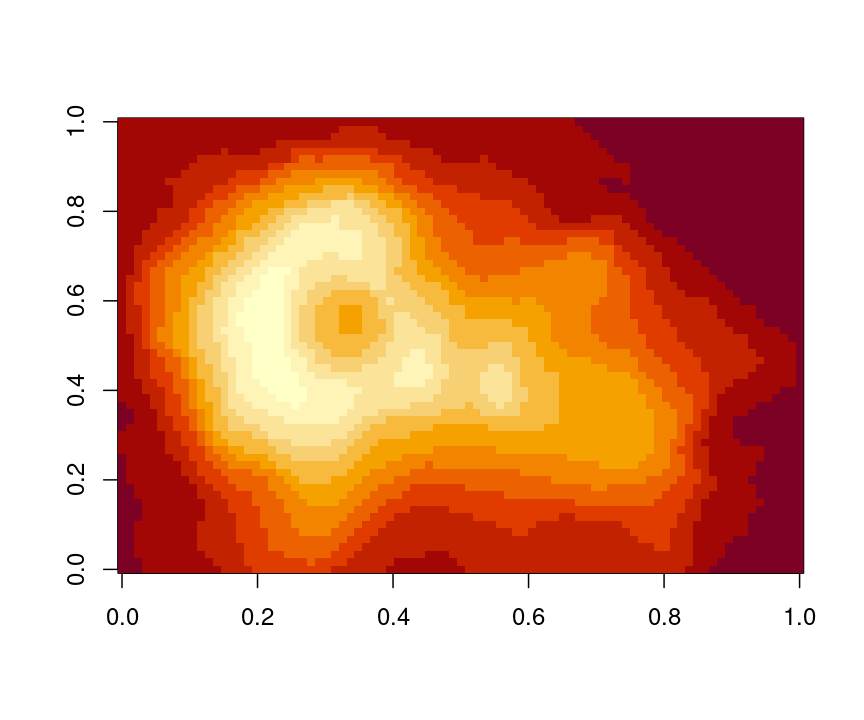
image(volcano, col = heat.colors(12))
image(volcano, col = hcl.colors(12, "YlOrRd"))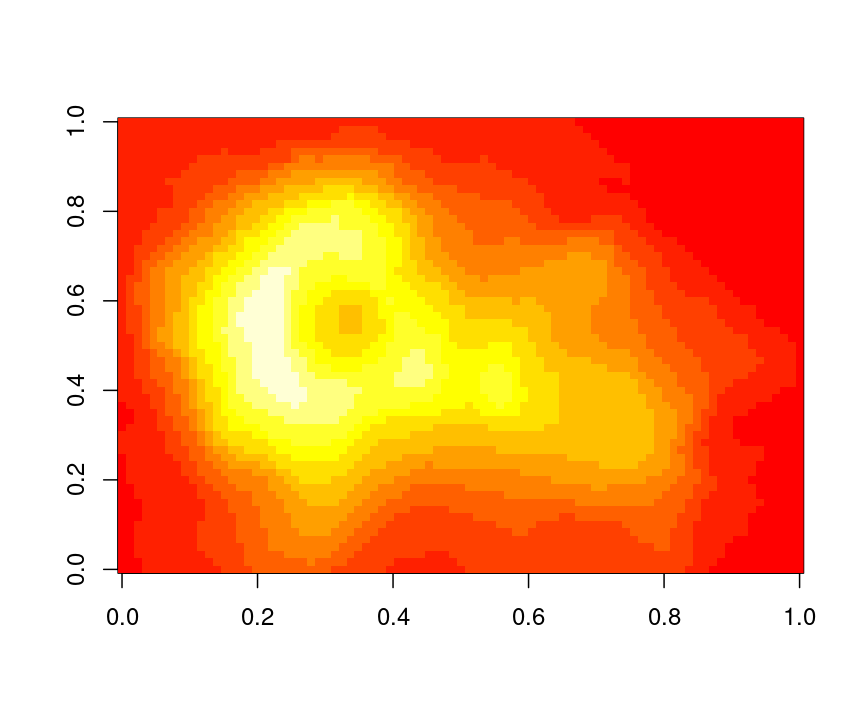
However, this ordering of colors is not optimal for bringing out a few
large/interesting values among many small/uninteresting values on a white
background. Therefore, by default the ordering is reversed, yielding a nicer
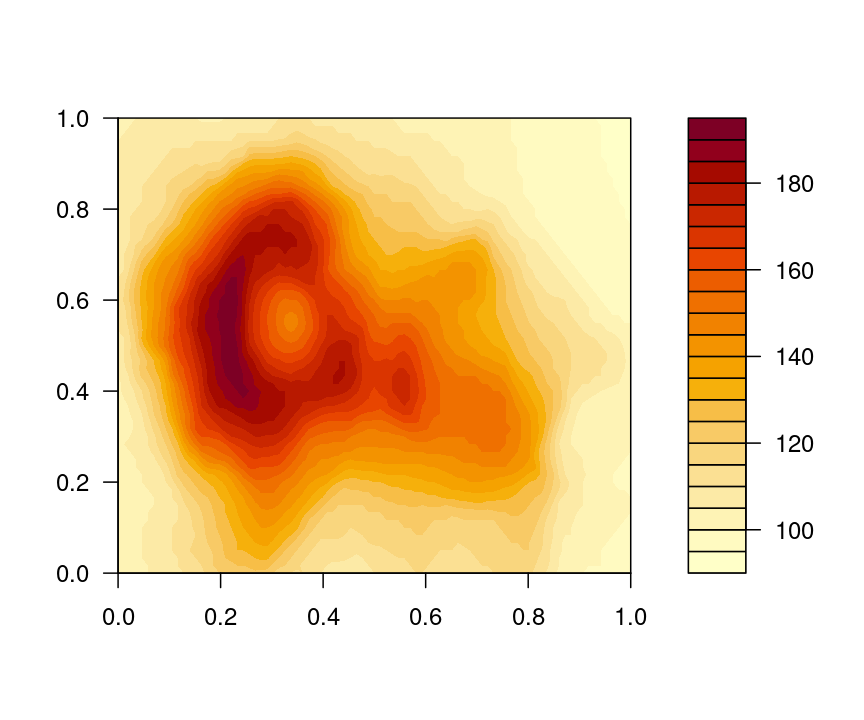
display which is now also consistent between image() and filled.contour().
image(volcano)
filled.contour(volcano)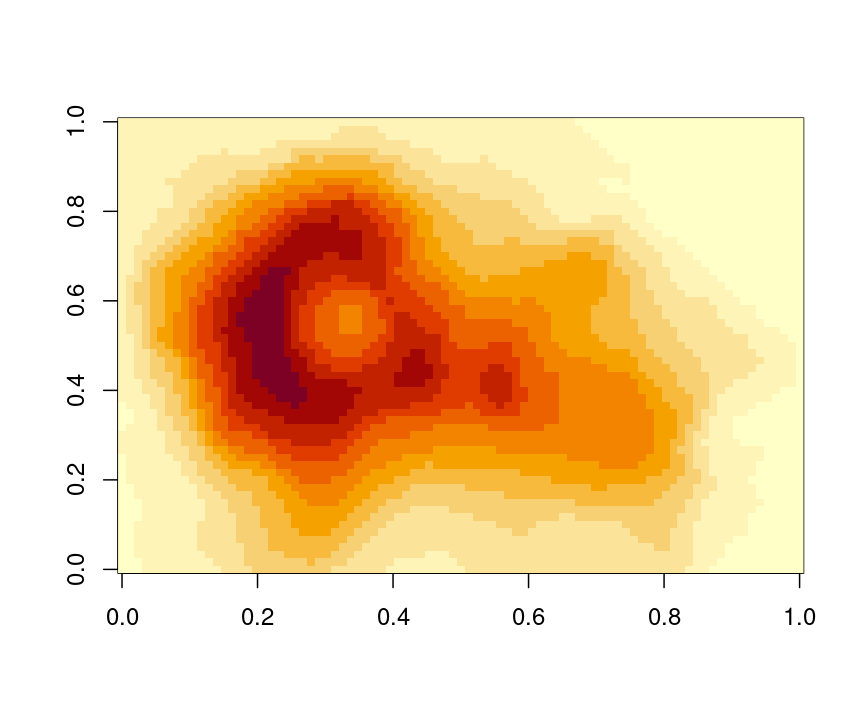
However, the reversal of colors in the palette might be undesired for displays that aim to bring out a few small values among many large values. Users and package developers that employ these functions with their default values are encouraged to test how well the new defaults work for them. Please let us know if you encounter problems.
References
Zeileis A, Fisher JC, Hornik K, Ihaka R, McWhite CD, Murrell P, Stauffer R, Wilke CO (2019). “ccolorspace: A Toolbox for Manipulating and Assessing Colors and Palettes.” arXiv:1903.06490, arXiv.org E-Print Archive. http://arxiv.org/abs/1903.06490.
Ihaka R (2003). “Colour for Presentation Graphics.” Proceedings of the 3rd International Workshop on Distributed Statistical Computing (DSC 2003), March 20-22, 2003, Technische Universität Wien, Vienna, Austria. http://www.ci.tuwien.ac.at/Conferences/DSC-2003/.
Zeileis A, Hornik K, Murrell P (2009). Escaping RGBland: Selecting Colors for Statistical Graphics. Computational Statistics & Data Analysis, 53, 3259-3270. 10.1016/j.csda.2008.11.033.